Appendix C — Experiments on hyper-k-mers
C.1 Datasets
Table C.1 lists the datasets used in the experiments and their characteristics.
| Name | Type | Coverage | # reads | Total length | Min. | Avg. | Max. |
|---|---|---|---|---|---|---|---|
SRR11434954 |
HiFi | 5000× | 1,789,131 | 23,122,913,014 | 46 | 12,924.1 | 26,294 |
SRR28370642 |
ONT Duplex | 50× | 114,703 | 236,908,842 | 349 | 2,065.4 | 126,029 |
SRR28370651 |
ONT Duplex | 50× | 109,061 | 226,502,819 | 330 | 2,076.8 | 125,012 |
SRR28370668 |
ONT Simplex | 2000× | 6,819,683 | 9,101,103,830 | 1 | 1,334.5 | 396,011 |
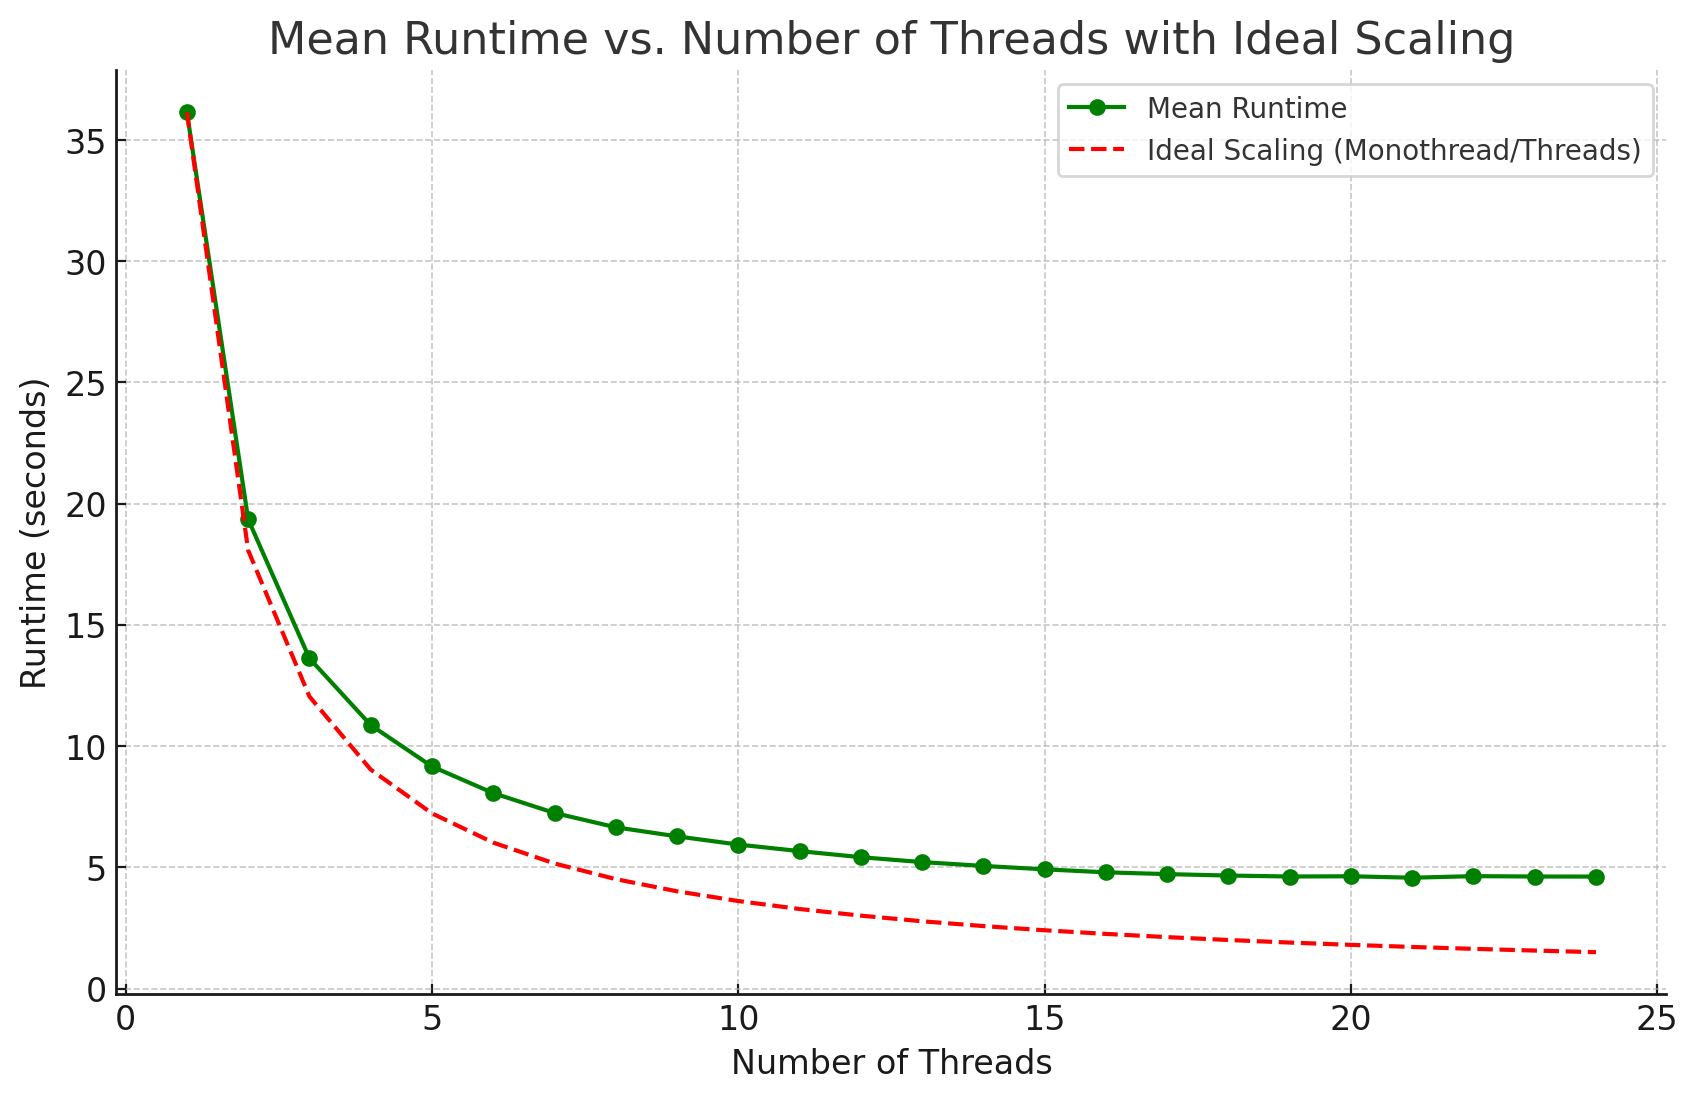
C.2 Multi-threading efficiency of KFC
In this section, we assess the multi-threading efficiency of KFC (Figure C.1). Our results demonstrate that KFC effectively utilizes multi-core architectures, achieving performance gains with up to several dozen cores before experiencing diminishing returns.
C.3 Metagenomic benchmarks
Figure C.2 and Figure C.3 confirm the trends of Section 14.4.1 on two larger HiFi metagenomic datasets.


C.4 Effect of coverage
Figure C.4 shows benchmarks similar to Figure 14.4 but at various coverage levels, without significant change in the relative behaviors of the tools.


C.5 Effect of not filtering unique k‑mers
In this section, we present the performance of KFC when unique k‑mers are not filtered out. Figure C.6 shows the results discussed in Section 14.4.1. They are similar to Figure 14.4, but without filtering unique k‑mers.


C.6 Pangenome benchmark
We evaluate the tools on one thousand S. enterica complete genomes from NCBI to assess the cost of counting large k‑mers across a pangenome (Figure C.7). KFC remains the most memory-efficient tool ahead of FastK and KMC, and for very large k‑mer sizes (k > 500) it also becomes the fastest, although its multithreading efficiency (analyzed in Section C.2) lags behind KMC on small input sizes, so it leads only when running on fewer threads.

